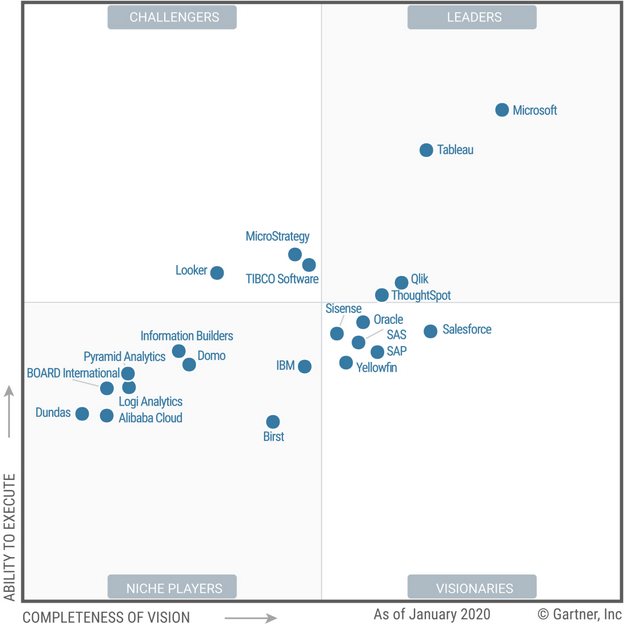
Augmented capabilities are becoming key differentiators for analytics and BI platforms, at a time when cloud
ecosystems are also influencing selection decisions. This Magic Quadrant will help data and analytics leaders evolve
their analytics and BI technology portfolios in light of these changes.
Strategic
Strategic Planning Assumptions
By 2022, augmented analytics technology will be ubiquitous, but only 10% of analysts will use its full potential.
By 2022, 40% of machine learning model development and scoring will be done in products that do not have machine learning as their primary
goal.
By 2023, 90% the world’s top 500 companies will have converged analytics governance into broader data and analytics governance initiatives.
By 2025, 80% of consumer or industrial products containing electronics will incorporate on-device analytics.
By 2025, data stories will be the most widespread way of consuming analytics, and 75% of stories will be automatically generated using
augmented analytics techniques.
Market Definition/Description
Modern analytics and business intelligence (ABI) platforms are characterized by easy-to-use functionality that supports a full analytic workflow
— from data preparation to visual exploration and insight generation — with an emphasis on self-service and augmentation. For a full definition
of what these platforms comprise and how they differ from older BI technologies, see “Technology Insight for Ongoing Modernization of Analytics and Business Intelligence Platforms.”
Vendors in the ABI market range from long-standing large technology firms to startups backed by venture capital funds. The larger vendors are
associated with wider offerings that includes data management features. Most new spending in this market is on cloud deployments.
ABI platforms are no longer differentiated by their data visualization capabilities, which are becoming commodities. Instead, differentiation is
shifting to:
- Integrated support for enterprise reporting capabilities. Organizations are interested in how these platforms, known for their agile data
visualization capabilities, can now help them modernize their enterprise reporting needs. At present, these needs are commonly met by older
BI products from vendors like SAP (BusinessObjects), Oracle (Business Intelligence Suite Enterprise Edition) and IBM (Cognos, pre-version
11). - Augmented analytics. Machine learning (ML) and artificial intelligence (AI)-assisted data preparation, insight generation and insight
explanation — to augment how business people and analysts explore and analyze data — are fast becoming key sources of competitive
differentiation, and therefore core investments, for vendors (see “Augmented Analytics Is the Future of Analytics”).
ABI platform functionality includes the following 15 critical capability areas (these have been substantially updated to reflect the refocus on
enterprise reporting and the increased importance of augmentation):
- Security: Capabilities that enable platform security, administering of users, auditing of platform access and authentication.
- Manageability: Capabilities to track usage, manage how information is shared and by whom, perform impact analysis and work with thirdparty
applications. - Cloud: The ability to support building, deploying and managing analytics and analytic applications in the cloud, based on data both in the
cloud and on-premises, and across multicloud deployments. - Data source connectivity: Capabilities that enable users to connect to, and ingest, structured and unstructured data contained in various types
of storage platforms, both on-premises and in the cloud. - Data preparation: Support for drag-and-drop, user-driven combination of data from different sources, and the creation of analytic models
(such as user-defined measures, sets, groups and hierarchies). - Model complexity: Support for complex data models, including the ability to handle multiple fact tables, interoperate with other analytic
platforms and support knowledge graph deployments. - Catalog: The ability to automatically generate and curate a searchable catalog of the artefacts created and used by the platform and their
dependencies. - Automated insights: A core attribute of augmented analytics, this is the ability to apply ML techniques to automatically generate insights for
end users (for example, by identifying the most important attributes in a dataset). - Advanced analytics: Advanced analytical capabilities that are easily accessed by users, being either contained within the ABI platform itself or
usable through the import and integration of externally developed models. - Data visualization: Support for highly interactive dashboards and the exploration of data through the manipulation of chart images. Included
are an array of visualization options that go beyond those of pie, bar and line charts, such as heat and tree maps, geographic maps, scatter
plots and other special-purpose visuals. - Natural language query: This enables users to query data using business terms that are either typed into a search box or spoken.
Data storytelling: The ability to combine interactive data visualization with narrative techniques in order to package and deliver insights in a
compelling, easily understood form for presentation to decision makers. - Embedded analytics: Capabilities include an SDK with APIs and support for open standards in order to embed analytic content into a
business process, an application or a portal. - Natural language generation (NLG): The automatic creation of linguistically rich descriptions of insights found in data. Within the analytics
context, as the user interacts with data, the narrative changes dynamically to explain key findings or the meaning of charts or dashboards. - Reporting: The ability to create and distribute (or “burst”) to consumers grid-layout, multipage, pixel-perfect reports on a scheduled basis.
Oracle
Oracle is a Visionary in this Magic Quadrant, for the first time since re-entering it in 2017. Its continued focus on augmented analytics is now
coupled with an improved go-to-market approach.
Oracle’s very broad ABI capabilities are available both in the Oracle Cloud and on-premises. Oracle Analytics Cloud (OAC) offers an integrated
design experience for interactive analysis, reports and dashboards.
During 2019, Oracle simplified its product packaging to three offerings, including a new offering for analytic applications, introduced new,
competitive pricing, and revamped its OAC customer success organization and customer and partner communities. It also continued to enhance
its innovative augmented analytics and NLP integration with OAC and collaboration tools, such as Slack and Microsoft Teams, and added an
analytics catalog.
Strengths
- Augmented analytics and robust NLG: Oracle has implemented augmented analytics capabilities across its platform earlier than most other
vendors, and reference customers reported broad use of its augmented analytics features. OAC also features NLG with adjustable tone and
verbosity in English and French (eight more languages are on Oracle’s roadmap). It is the only platform on the market to support NLQ in 28
languages. - Product vision: Oracle continues to invest aggressively in augmented analytics capabilities and consumer-like, conversational user
experiences, including chatbot integration coupled with autogenerated insights. These are central to OAC and Day by Day, Oracle’s mobile app. - Range of use cases: Pyramid supports agile workflows and governed, report-centric content within a single platform and interface. Its
solution is well-suited to governed data discovery, with features such as BI content watermarking, reusability and sharing of datasets,
metadata management and data lineage. - Augmentation: Augmented features such as Smart Discovery, Smart Reporting, Ask Pyramid (NLQ), AI-driven modeling, automatic
visualizations and dynamic content offer powerful insights to all users, regardless of skill level. - Ease of deployment and administration, with single workflow: Reference customers scored Pyramid higher than most vendors for overall
experience with the tool. They particularly value the platform’s single integrated workflow that supports all ABI use cases.
Cautions
- Product vision and innovation: Pyramid has made significant progress over the past few years, but is still only catching up with the visionary
elements delivered by competitors. - Availability of market resources: Reference customers for Pyramid scored it below the average for the availability and quality of third-party
resources such as integrators and service providers. They also gave a below-average score for the quality of Pyramid’s peer user community. - Lack of market recognition: 2018 and 2019 were retooling and transition years for Pyramid. In 2020, it is focused on market growth and
product differentiation — something that Pyramid has struggled to communicate in a crowded market.
Original article can be found on Gartner web site. Click here to view.
Gartner 2020 Gartner Magic Quadrant for Analytics and Business Intelligence Platforms, James Richardson, Rita Sallam, Kurt Schlegel, Austin Kronz, Julian Sun, February 2020
Gartner does not endorse any vendor, product or service depicted in its research publications, and does not advise technology users to select only those vendors with the highest ratings or other designation. Gartner research publications consist of the opinions of Gartner’s research organization and should not be construed as statements of fact. Gartner disclaims all warranties, expressed or implied, with respect to this research, including any warranties of merchantability or fitness for a particular purpose.


